- Monitor quality continuously across all production traffic
- Catch regressions immediately when they occur
- Evaluate at scale without manual intervention
- Get insights into real user interactions and edge cases
Create scoring rules
Online scoring rules are defined at the project level and specify which scorers to run, how often, and on which logs. Once configured, these rules automatically evaluate production traces as they arrive.- UI
- SDK
In the Braintrust UI, create a scoring rule in project settings, when setting up a scorere, or when testing a scorer.
- Project settings: Go to Settings > Project > Automations and click + Create rule. See Manage projects for more details.
- Scorer setup: When creating or editing a scorer, click Automations and either select an existing scoring rule or create a new rule. This workflow allows you to configure both the scorer and its scoring rules together. See Write scorers for more details.
- Scorer testing: When testing a scorer with logs in the Run section, filter logs to find relevant examples, then click Automations to create a new online scoring rule with filters automatically prepopulated from your current log filters. This enables rapid iteration from logs to scoring rules. See Test with logs for more details.
Rule parameters
Configure each rule with:- Rule name: Unique identifier.
- Description: Explanation of the rule’s purpose.
- Project: Select which project the rule belongs to. When creating from a scorer page, you can choose any project.
- Scorers: Choose from autoevals or custom scorers from the current project or any other project in your organization. When creating from a scorer page, the current scorer is automatically selected.
- Sampling rate: Percentage of logs to evaluate (e.g., 10% for high-volume apps).
-
Scope: Choose the evaluation scope:
- Trace (default): Evaluates entire execution traces. The scorer runs once per trace and can access all spans and conversation history via
trace.getThread()andtrace.getSpans(). Use trace scope for trace-level scorers that assess multi-turn conversations or multi-step workflows. - Span: Evaluates individual spans. Each matching span is scored independently.
- Trace (default): Evaluates entire execution traces. The scorer runs once per trace and can access all spans and conversation history via
-
Apply to spans (span scope only): When using span scope, choose which spans to score:
- Root spans toggle: Score root spans (top-level spans with no parent)
- Span names: Score spans with specific names (comma-separated list)
-
SQL filter: Filter spans based on input, output, metadata, etc., using a SQL filter clause.
The
!=operator is not supported in SQL filters for online scoring. UseIS NOTinstead.
View scoring results
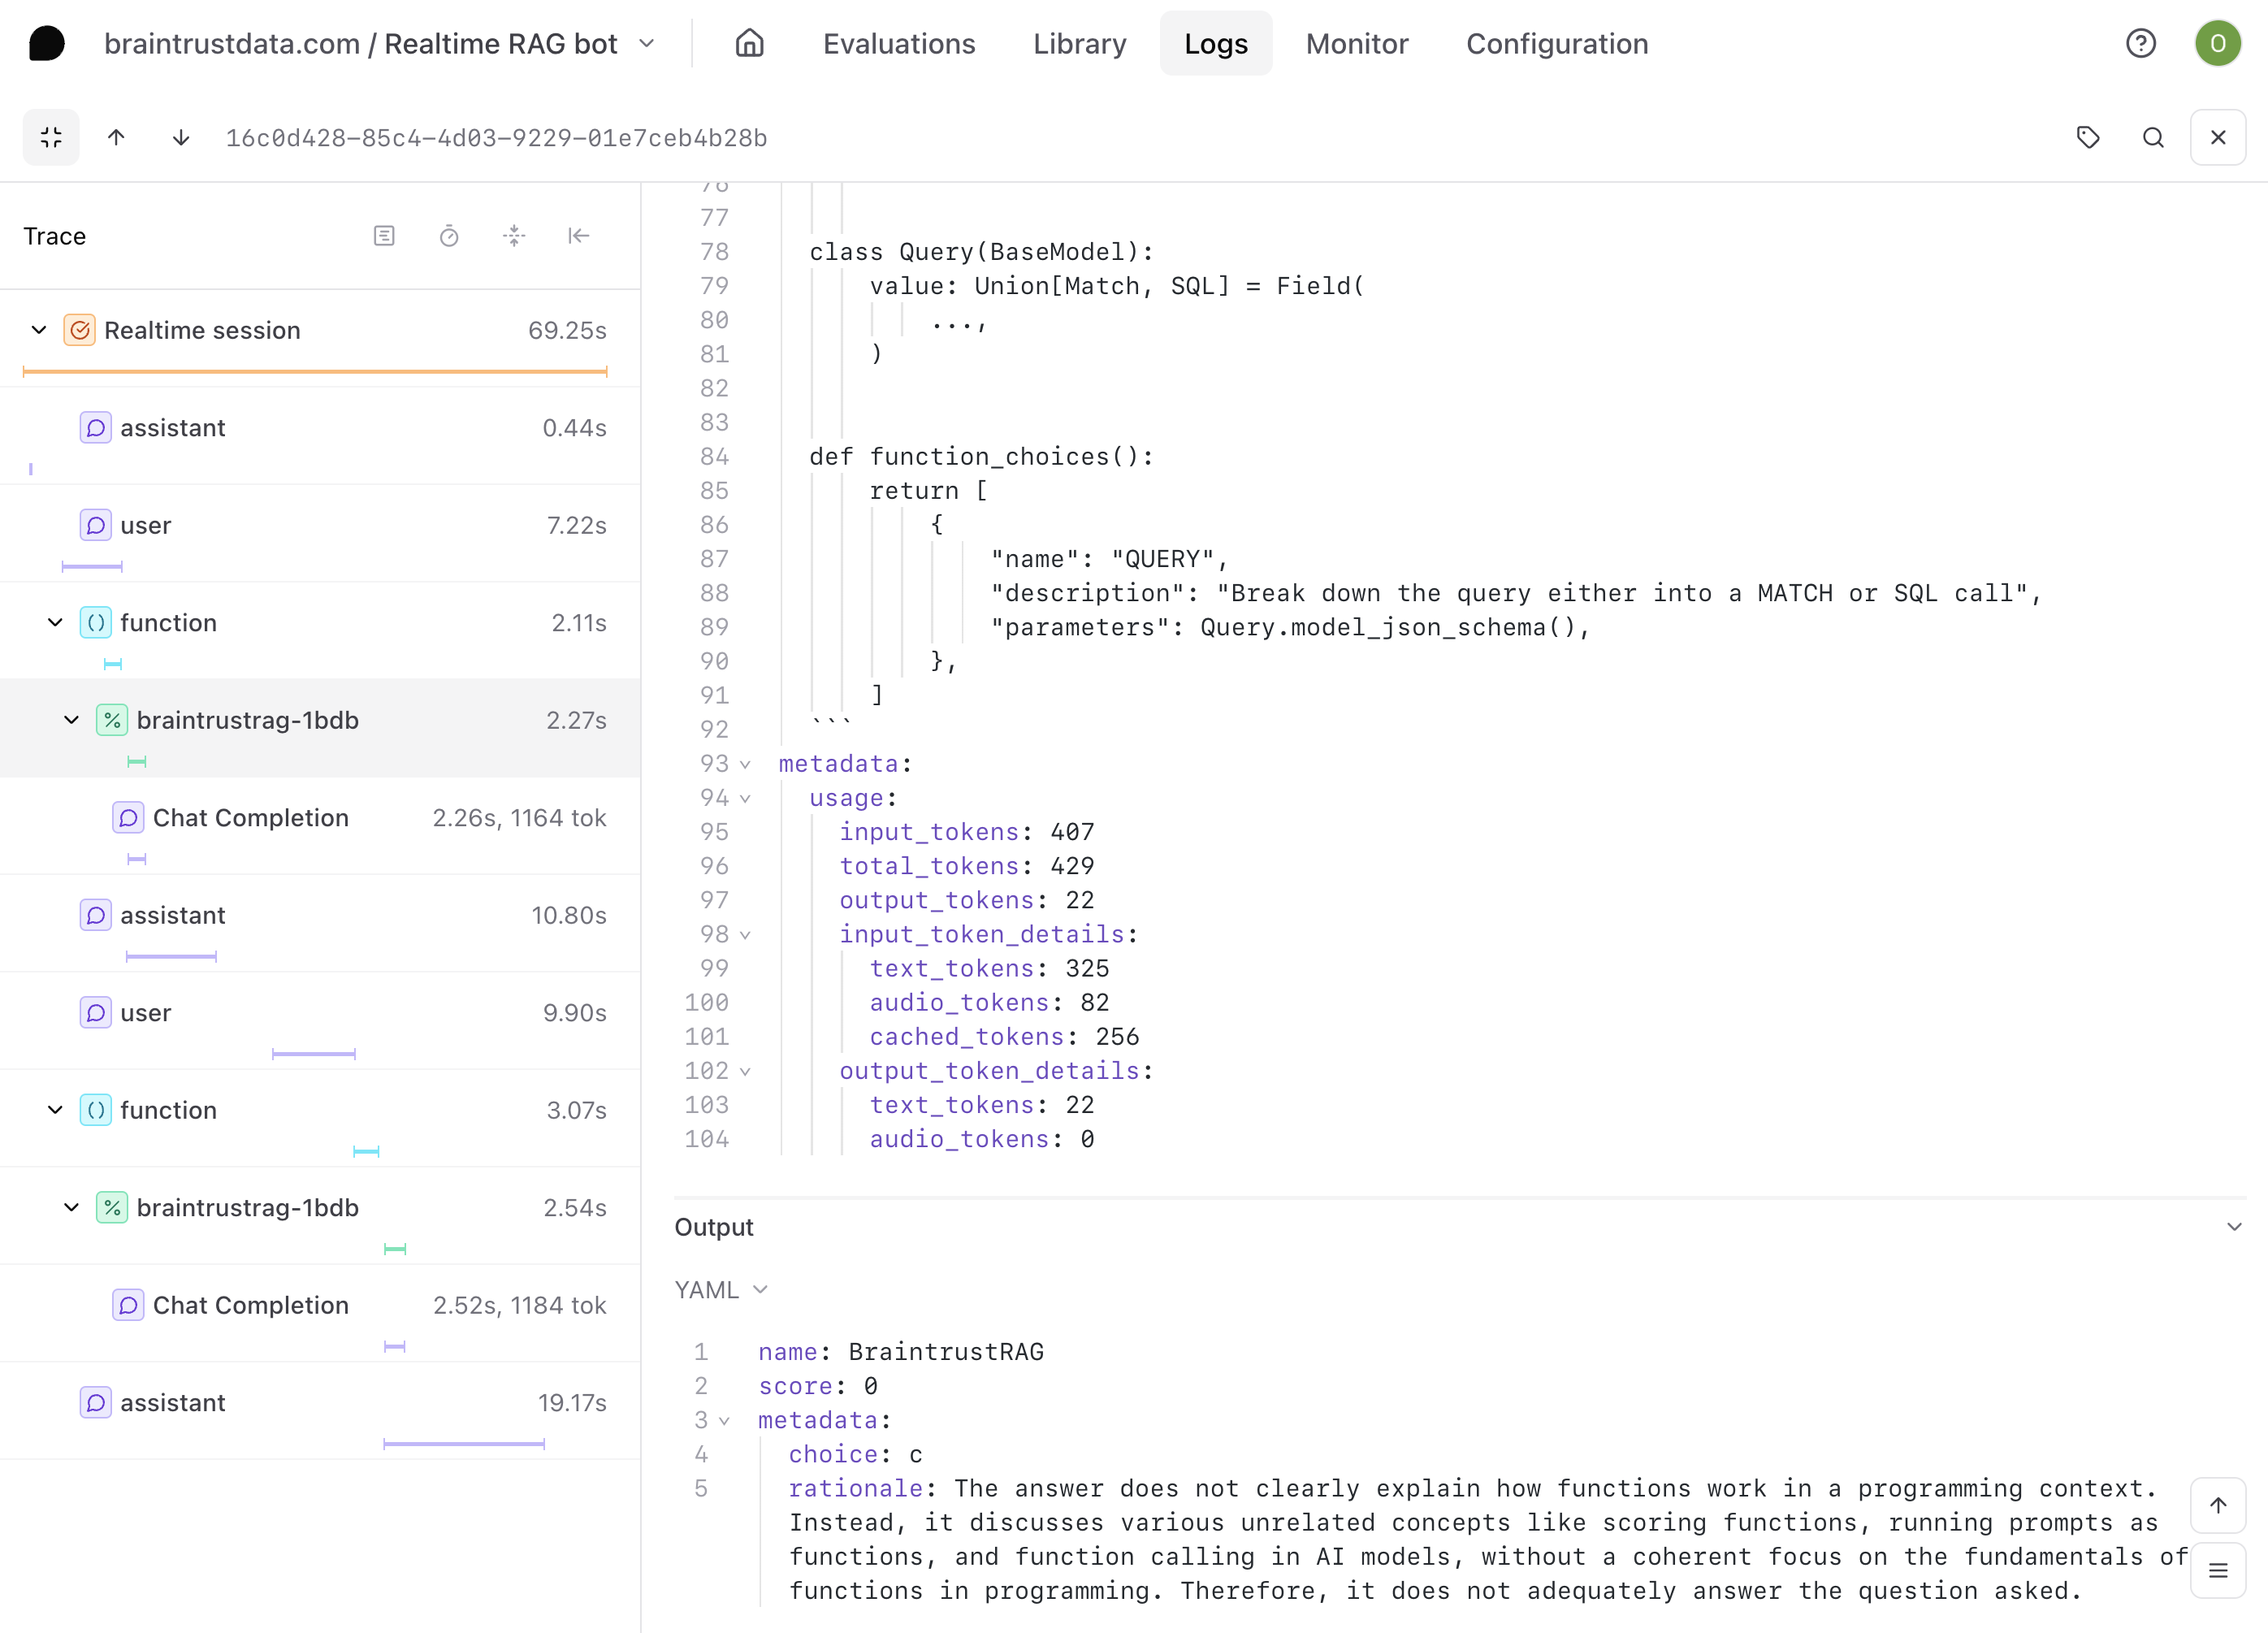
Scores appear automatically in your logs. Each scored span shows:- Score value (0-1 or 0-100 depending on scorer)
- Scoring span containing evaluation details
- Scorer name that generated the result

Score manually
To apply scorers to historical logs:- Specific logs: Select logs and use Score to apply chosen scorers
- Individual logs: Open any log and use Score in the trace view
- Filtered logs: Filter logs to narrow your view, then use Score existing logs under Automations to apply scorers to recent logs matching your filters
Best practices
Choose sampling rates wisely: High-volume applications should use lower rates (1-10%) to manage costs. Low-volume or critical applications can use higher rates (50-100%) for comprehensive coverage. Complement offline evaluation: Use online scoring to validate experiment results in production, monitor deployed changes, and identify new test cases from real interactions. Consider scorer costs: LLM-as-a-judge scorers have higher latency and costs than code-based alternatives. Factor this into your sampling rate decisions. Choose the right scope: Use span scope for evaluating individual operations or outputs. Use trace scope for evaluating multi-turn conversations, overall workflow completion, or when your scorer needs access to the full execution context.Troubleshoot issues
Low or inconsistent scores
- Review scorer logic to ensure criteria match expectations.
- Verify scorers receive the expected data structure.
- Test scorer behavior on controlled inputs.
- Make LLM-as-a-judge criteria more specific.
Missing scores
- Check Apply to spans settings to ensure correct span types are targeted (root spans or specific span names).
- Verify logs pass the SQL filter clause. Confirm your logs’ data (input, output, metadata) matches the filter criteria.
- Confirm sampling rate isn’t too low for your traffic volume.
- Ensure API key or service token has proper permissions (Read and Update on project and project logs). If using scorers from other projects, ensure permissions on those projects as well.
- Verify span data is complete when
span.end()is called:- Online scoring triggers when
span.end()is called (or automatically when usingwrapTraced()in TypeScript or@traceddecorator in Python) - The SQL filter clause evaluates only the data present at the moment
span.end()is called - If a span is updated after calling
end()(e.g., logging output after ending), the update won’t be evaluated by the filter. For example, if your filter requiresoutput IS NOT NULLbut output is logged afterspan.end(), the span won’t be scored
- Online scoring triggers when
Next steps
- Create dashboards to monitor score trends
- Build datasets from scored production traces
- Run experiments to validate scoring criteria
- Learn about creating scorers